.NET Disassembled
Part 1: integers in .NET
Part 2: This post
This is my second post on .NET performance, in this series of posts I will try to show how .NET code performs compared to pure C++ code.
Today I will show how a C# for loop compares to a Win32 C++ for loop.
First we need some sample code to compare, so here it is:
The C# code:

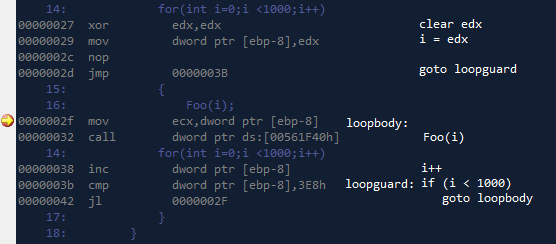
The Win32 C++ code:

I hope we can agree that the above code is fairly similair, we loop “i” from 0 to 999 and call the function “Foo” while doing so.
I will begin with the disassembly for the C++ code, just so we can see how optimized it is:

What are we seeing here?
The “i” variable have been replaced with a native register (esi) which is set to 1000.
The Foo function have been inlined in the for loop.
The loop guard have been optimized to “esi — ; if esi >0 goto loopbody” since this is more efficient in native code (dec,jne)
So the C++ code is clearly very optimized.
So how does the C# counterpart hold up against the optimized C++ code?
[Edit] big thanks to Omer for pointing out how to disassemble the optimized .NET code.

Just like the C++ version, the variable “i” have been replaced with a native register, “esi”
The Foo function call have been inlined (address 6-18), do note that calling console.writeline is not the same as calling cout in win32, so the code will differ.
So the optimized .NET code is pretty much equal to the win32 C++ version.
Hope this can crush some of the myths floating around…
//Roger

By compiling in debug mode and/or starting under the debugger, you disable many of the CLR JIT’s optimizations. To see how the non-debug JIT produces code, one approach is to put a Console.ReadLine in your code. Build a release-mode EXE and run it without using the debugger. When the program pauses at the ReadLine, attach a debugger. You’ll see that the call to Foo has been inlined, that there’s no NOP and that a register is now being used to hold the loop variable:
00000028 xor esi,esi
0000002a call 6F0D7060
0000002f mov ecx,eax
00000031 mov edx,dword ptr ds:[03332034h]
00000037 mov eax,dword ptr [ecx]
00000039 mov eax,dword ptr [eax+3Ch]
0000003c call dword ptr [eax+10h]
0000003f inc esi
00000040 cmp esi,3E8h
00000046 jl 0000002A
Interesting post Roger, I am curious, did you compile the .net code with optimizations enabled? I am quite sure that it should inline that the Foo function in that case.
– Egil
Yes, both the C# and the C++ code is compiled in release mode with optimizations on.
So I’m not quite sure why it wasn’t inlined.. (have double checked plenty of times)
When you start with the debugger attached, the JIT turns off the same optimizations that are turned off in debug mode. In order to avoid that, one approach is to put a ReadLine() at the spot you’re interested in, start without debugging, and then attach the debugger once you get to the ReadLine(). In this case, the loop produces code like the following:
00000028 xor esi,esi
0000002a call 6F0D7060
0000002f mov ecx,eax
00000031 mov edx,dword ptr ds:[03332034h]
00000037 mov eax,dword ptr [ecx]
00000039 mov eax,dword ptr [eax+3Ch]
0000003c call dword ptr [eax+10h]
0000003f inc esi
00000040 cmp esi,3E8h
00000046 jl 0000002A
(not sure if it is there just because the debugger is attached)
Well, you could perhaps attach Ollydbg and see what the compiler actually does to your code whilst compiling it. In real-time ;)
It doesn’t inline because you’re running with a debugger attached.
When you do that, the JIT compiler will not use all the optimization tricks it can, when compiling IL to native code.
To get the fully optimized native code I did the following:
1. Took your code
2. Added a Console.ReadLine() at the end
3. Ran without a compiler (CTRL-F5)
4. When the program reached the ReadLine() line I attached a debugger, and hit Break.
This is the disassembled code I got:
    17:             Console.WriteLine("hello");

00000000  push        ebp

00000001  mov         ebp,esp

00000003  push        esi

00000004  call        56727060

00000009  mov         ecx,eax

0000000b  mov         edx,dword ptr ds:[02D62030h]

00000011  mov         eax,dword ptr [ecx]

00000013  mov         eax,dword ptr [eax+3Ch]

00000016  call        dword ptr [eax+10h]

    18:             for (int i = 0; i < 1000; i++)

00000019  xor         esi,esi

    19:             {

    20:                 Foo(i);

0000001b  call        56727060

00000020  mov         ecx,eax

00000022  mov         edx,dword ptr ds:[02D62030h]

00000028  mov         eax,dword ptr [ecx]

0000002a  mov         eax,dword ptr [eax+3Ch]

0000002d  call        dword ptr [eax+10h]

    18:             for (int i = 0; i < 1000; i++)

00000030  inc         esi

00000031  cmp         esi,3E8h

00000037  jl          0000001B

    22:             Console.WriteLine();

00000039  call        56CFA610

0000003e  mov         ecx,eax

00000040  mov         eax,dword ptr [ecx]

00000042  mov         eax,dword ptr [eax+2Ch]

00000045  call        dword ptr [eax+1Ch]

00000048  pop         esi

    23:         }

00000049  pop         ebp

0000004a  ret
As you can see, the code is much more optimized. It uses a register for i (esi), and Foo has been inlined.
JIT knows when debugging is attached. Instead of dissolving the myths you’re just creating them :-(
Insert Debugger.Launch()/Break() at the beginning of Main, and run outside of Visual Studio.
Foo does get inlined, i does go into a register (same esi as in C++). Of course there is no nop at all.
The method (Console.WriteLine) invocation is a bit wordy in .NET though, about 6 instructions instead of simple ‘call’. It may be related to AppDomain and static constructors.